
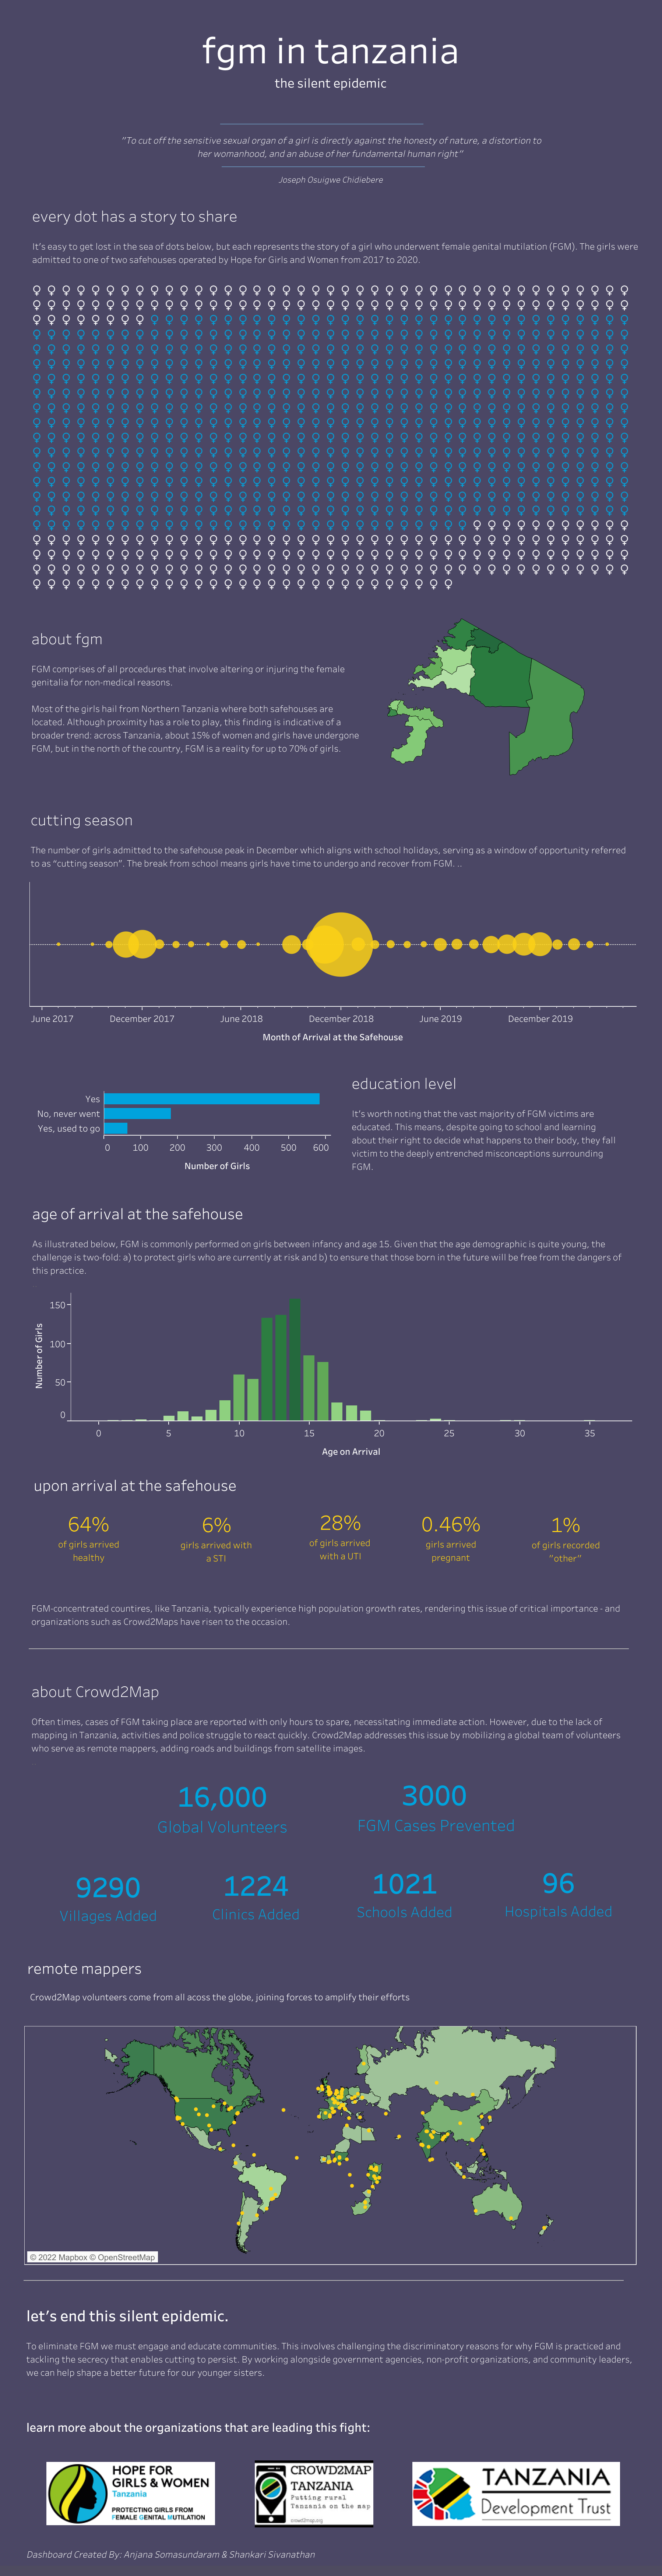
As part of the Data Viz Challenge, I created a dashboard that outlines the state of female genital mutiliation (FGM) in Tanzania and highlights the work of a local-non profit called Crowd2Map. The grassroots organization collects geospatial data and plots more robust maps to aid in the fight against FGM. You can view the interactive dashboard here. For background context, FGM comprises of all procedures that involve altering or injuring the female genitalia for non-medical reasons. Across Tanzania, approx. 15% of women and girls have undergone FGM.
While sifting through nearly 5000 rows of data, it became evident that Crowd2Maps was leading incredibly powerful work—the organization plays a key role in being able to access remote areas of Tanzania where FGM takes place in secret. Their maps are used regularly by police and rescue teams to reach these areas more efficiently – particularly as these missions often take place at night. However, without awareness about FGM and its repercussions, private donors will not be receptive to providing monetary support. As such, I set out to answer the following question:
How can we clearly articulate Crowd2Map's impact to increase donations?
The interactive dashboard successfully communicates the organization's impact by spotlighting a plethora of data points, including the following:
shoot an email to anja.somar@gmail.com